
Reviewer: Mujahidul Haque | Digital Transformation & ERP Consultant
Date: June 2025
Executive Summary
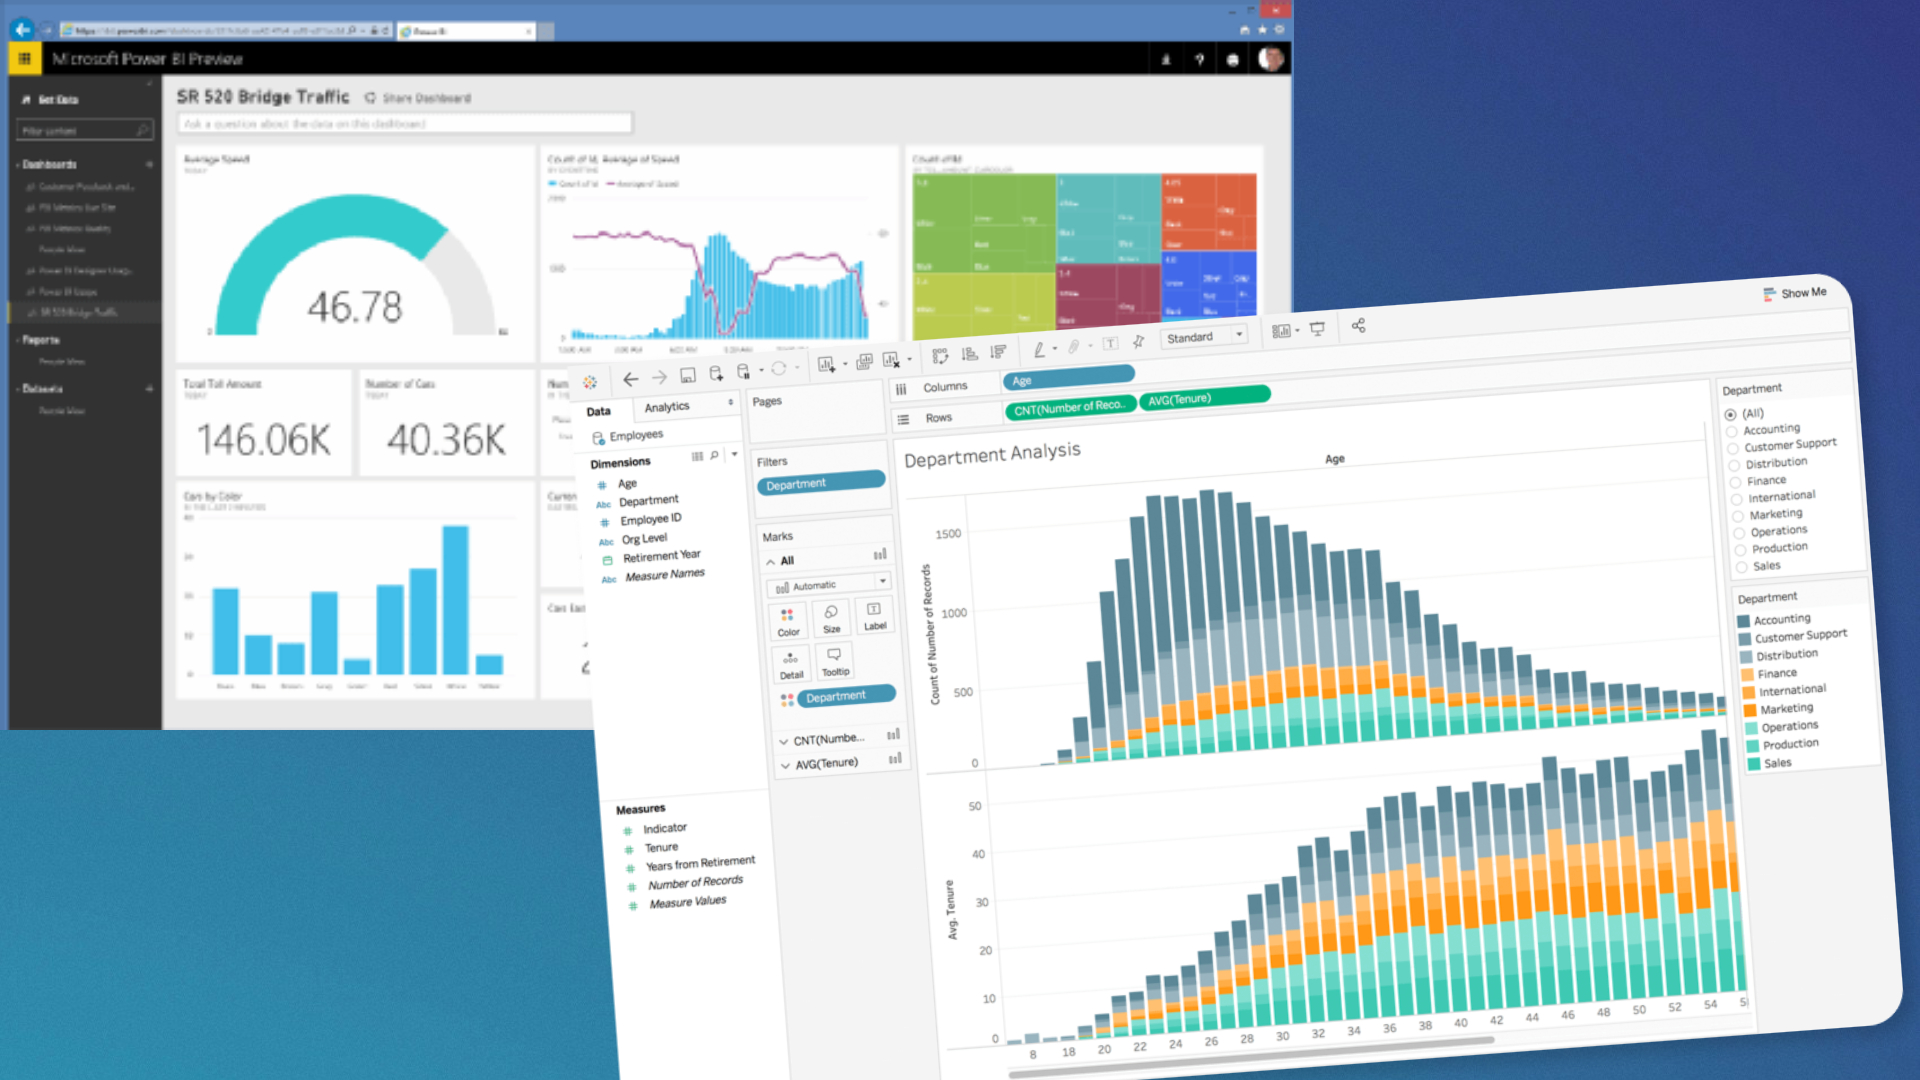
As organizations increasingly embrace data-driven strategies, Tableau and Microsoft Power BI stand out as two of the most powerful Business Intelligence (BI) platforms available. This review critically evaluates both tools across core features, enterprise capabilities, usability, integration potential, and total cost of ownership (TCO). Drawing from real-world consulting and implementation experience, this comparison is intended for decision-makers seeking scalable, effective analytics ecosystems for modern enterprises.
Overview of Each Platform
| Criteria | Tableau | Microsoft Power BI |
| Owner | 2003 | 2015 |
| Primary Focus | Advanced visual analytics and dashboarding | Integrated business analytics within MS ecosystem |
| Deployment | On-premise, cloud (Tableau Cloud), hybrid | Cloud (Power BI Service), Desktop, Premium (on-prem hybrid) |
| Launched | 2003 | 2015 |
Core Features Comparison
| Feature Area | Tableau | Power BI |
| Data Connectivity | Extensive connectors; strong for enterprise DBs, REST APIs, SAP, Hadoop | Strong for Microsoft stack (Excel, SQL, Azure, D365); broad 3rd-party support |
| Data Modeling | Focus on visual joins, calculated fields, live or extracted data sources | Star schema support, DAX language, powerful model layer |
| Visualization | Rich, custom visuals; pixel-perfect dashboards; interactive storytelling | Pre-built templates, standard charts, custom visuals via marketplace |
| Analytics & AI | Trend lines, clustering, R integration, Python scripting | Native AI visuals (decomposition tree, key influencers), ML via Azure |
| Real-time Analytics | Near real-time; needs additional setup (e.g., Tableau Bridge) | Native streaming with Azure Stream Analytics or Power Platform |
| Embedding/Extensibility | Tableau JavaScript API, embedded dashboards, extensions | Power BI Embedded, REST API, Azure Functions |
| Collaboration & Sharing | Tableau Server or Cloud; strong permission control | Power BI Service, Teams integration, row-level security (RLS) |
| Mobile Experience | Responsive mobile dashboards, app-based interactivity | Strong Power BI mobile app, responsive reports |
Enterprise Effectiveness
Tableau
Strengths:
- Best-in-class visual storytelling
- Favored by data scientists and analysts
- Strong in financial services, healthcare, and retail
Weaknesses:
- Steep learning curve for new users
- Licensing can be expensive
- Complex governance for large teams
Power BI
Strengths:
- Seamless integration with Microsoft ecosystem (Excel, Teams, D365, Azure)
- Enterprise-ready with Power BI Premium
- Easy adoption across departments due to Excel-like interface
Weaknesses:
- Advanced visuals and formatting flexibility slightly behind Tableau
- Performance bottlenecks for very large datasets unless optimized
AI & Advanced Analytics
| Function | Tableau | Power BI |
| Natural Language Query (NLQ) | “Ask Data” | “Q&A” visual with natural language search |
| Forecasting | Time-series forecasting, trend lines | ARIMA, Prophet via Python/R or Azure ML integration |
| Machine Learning Integration | Python, R, Einstein Discovery (Salesforce) | Azure ML, AutoML, Cognitive Services |
| Augmented Analytics | Manual model integration | Built-in “Key Influencer” visual, Smart Narratives |
Licensing & TCO (Total Cost of Ownership)
| Component | Tableau | Power BI |
|---|
| Entry-Level Pricing | ~$15–$70/user/month (Viewer/Explorer/Creator) | Free to $20/user/month (Pro), Premium $5K+/month |
| On-Prem Deployment Cost | Tableau Server required | Power BI Report Server (with Premium) |
| Enterprise Cost Model | Role-based user licensing | Flat user or capacity-based Premium pricing |
| Integration Add-Ons | Einstein Analytics, Salesforce Data Cloud | Azure Synapse, Fabric, Dynamics 365 |
Power BI typically offers lower TCO for Microsoft-centric enterprises. Tableau can be cost-effective for teams needing deep analytics but may scale expensively.
Integration & Ecosystem
| Platform | Ecosystem Strength |
|---|
| Tableau | Strong integrations with Salesforce, AWS, Snowflake, and R/Python |
| Power BI | Native tie-ins with Excel, SharePoint, D365, Power Apps, Azure Synapse |
For Microsoft-based enterprises, Power BI is the natural fit. Tableau fits better where Salesforce, Snowflake, or mixed-tech environments dominate.
Use Case Alignment
| Use Case | Recommended Tool |
|---|
| Financial Dashboards | Tableau (precision visuals) |
| Embedded Reporting in SaaS | Power BI (via Power BI Embedded) |
| Organization-wide reporting | Power BI |
| Data Science Integration | Tableau + Python/R |
| Rapid self-service BI rollout | Power BI |
Conclusion
Both Tableau and Power BI are world-class platforms—but their strengths serve different enterprise needs:
- Choose Tableau if your organization emphasizes high-end visualization, data storytelling, and advanced analytics teams.
- Choose Power BI if you’re operating in a Microsoft ecosystem, need faster deployment, broader enterprise scalability, and cost-efficiency.
Ultimately, the best choice depends on your data environment, user maturity, integration needs, and strategic IT roadmap.
Leave a Reply